





Our Impact

Here's what our partners are saying...

IEL Impact Highlights

July 2025 – June 2026

Key Performance Indicators

Networks

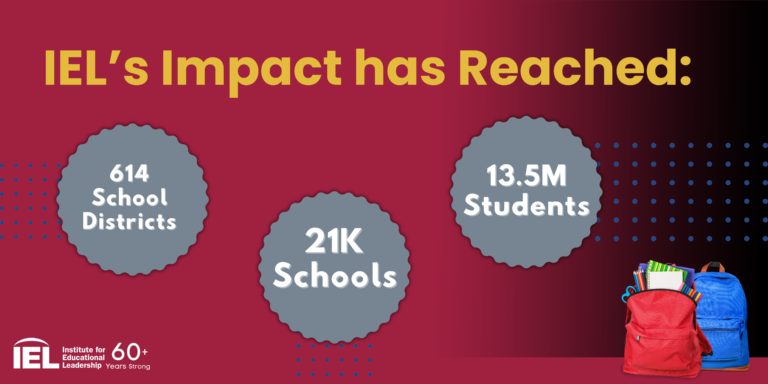
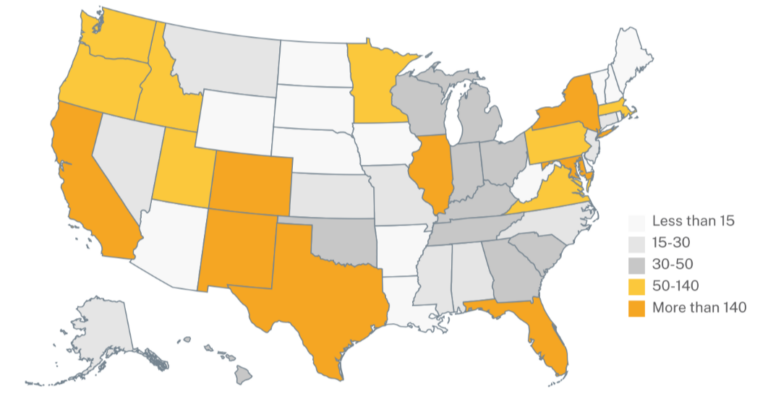
Through all IEL services, we serve 614 districts, representing 20,812 schools and 13.5 million students. The U.S. map below shows the school leaders, teachers, families, and students who received IEL services in FY26.

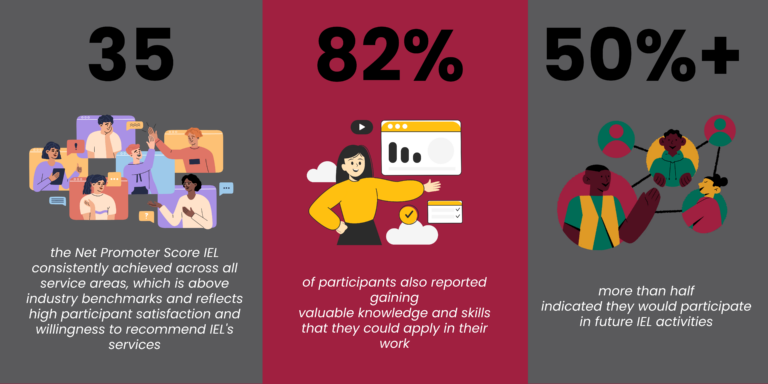
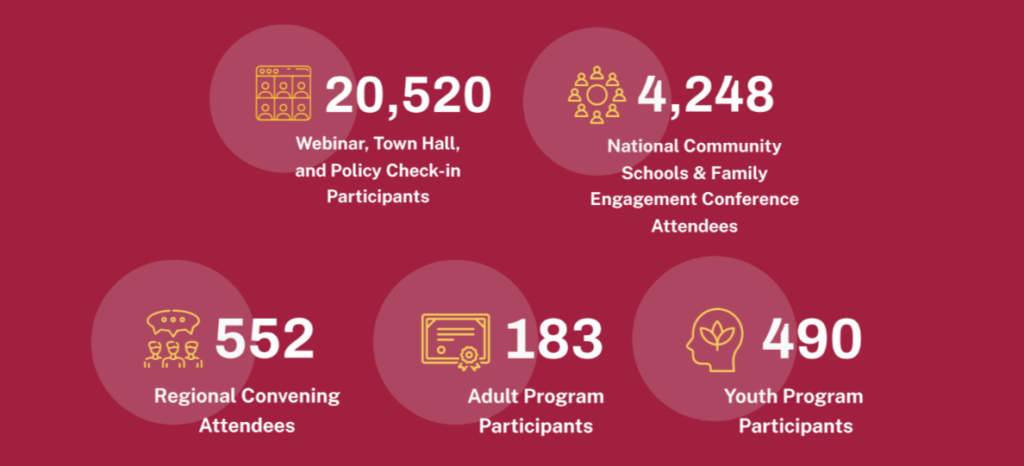
In FY26, IEL actively managed ten (10) national networks, engaging more than 13,800 education, workforce, and community leaders. IEL continued to strengthen the member experience by enhancing the quality of network meetings, webinars, and capacity-building opportunities that foster collaboration, knowledge sharing, and peer learning. Beyond regular network activities, IEL significantly expanded participation in its virtual and in-person convenings, including webinars, town halls, policy check-ins, and the Community Schools × Family Engagement Conference, reaching more than 24,800 participants. These learning experiences consistently received strong participant feedback, with high satisfaction ratings, meaningful knowledge gains, and Net Promoter Scores that exceeded industry benchmarks.

IEL Service Participants in FY26

Convenings

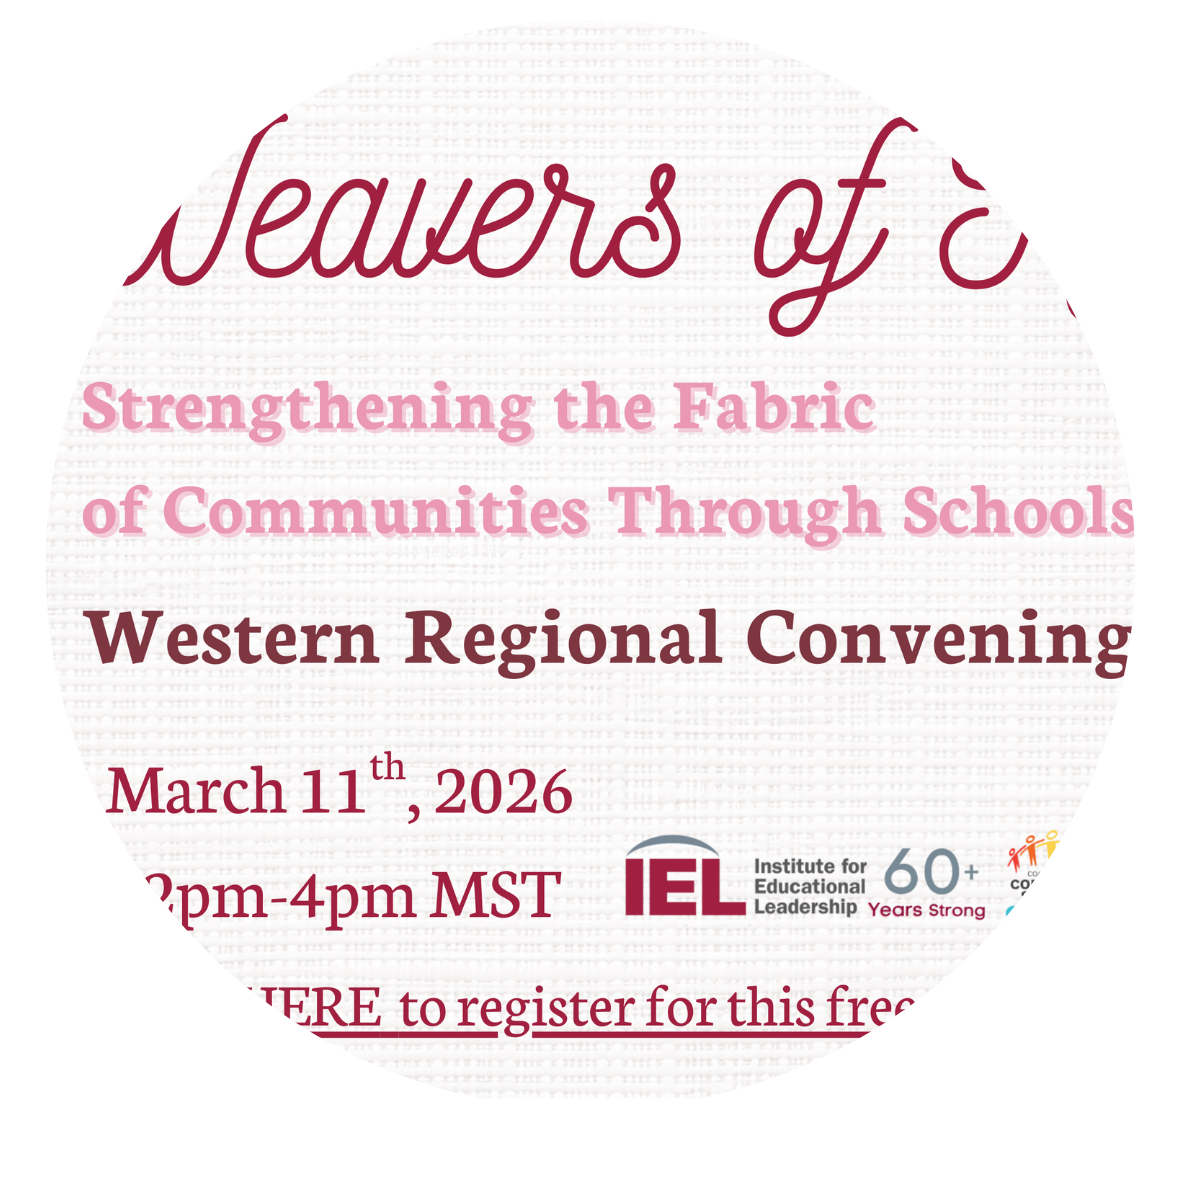
In FY26, IEL significantly expanded its portfolio of virtual and in-person convenings, providing more opportunities for education, workforce, and community leaders to learn, connect, and collaborate. Throughout the year, IEL increased both the number and diversity of convenings, offering timely webinars, town halls, policy check-ins, conferences, and other learning events that addressed emerging issues and shared promising practices across the field. These expanded offerings drove record participation, with attendance growing from 15,200 in FY25 to about 24,800 participants in FY26. Growth was fueled by a substantial increase in engagement with virtual learning opportunities and continued strong attendance at flagship in-person events, demonstrating the value of accessible, high-quality professional learning experiences. Together, these convenings strengthened networks, fostered knowledge exchange, and equipped leaders with the tools and connections needed to advance systems change in their communities.

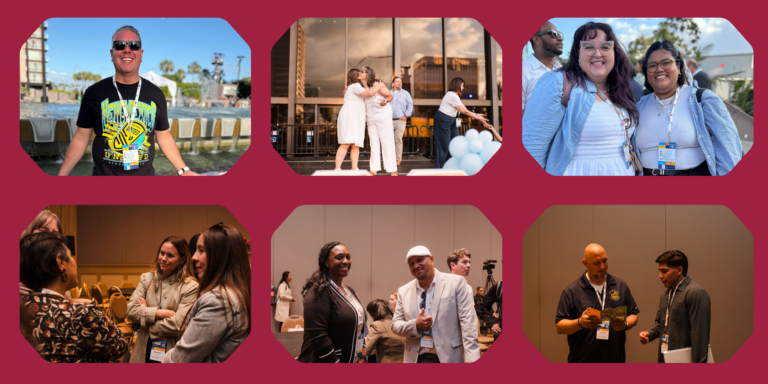
"Looking back on the last school year, one of the experiences I’m most grateful for was attending the IEL Community Schools & Family Engagement Conference in Long Beach, California. After attending IEL's [conference] last year, I already knew how meaningful this conference could be. This year, I left with an even greater appreciation for the work IEL is doing to bring educators, community leaders, organizers, families, and advocates together around educational leadership, family engagement, community schools, equity, and student voice. "

Policy Highlights

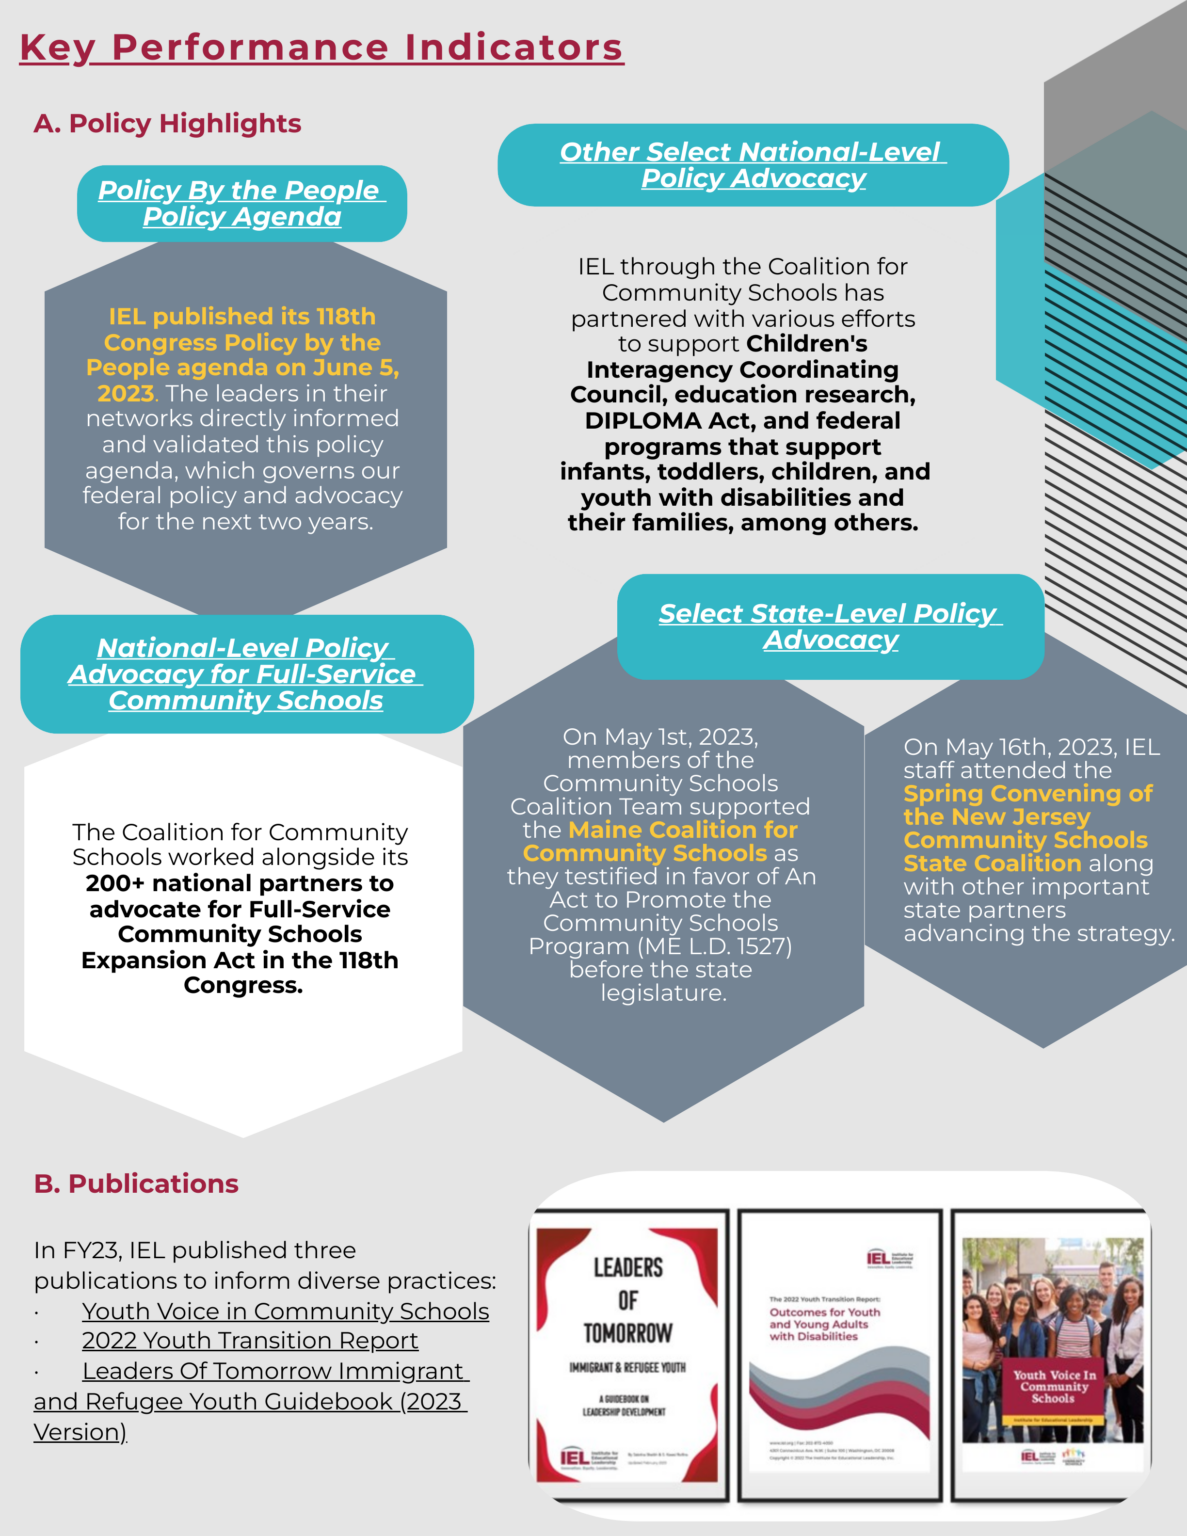
IEL continued to develop practical policy resources and advocacy tools that empowered network members to engage in effective policy advocacy.

During FY26, IEL published policy briefs and state analyses on topics such as blending and braiding funding for Community
Schools and tracking governors’ education priorities against legislative outcomes, while maintaining an expanding library of
advocacy guides, legislative trackers, webinars, and policy toolkits.

Publications

In FY26, IEL continued to advance the field by developing timely research, data resources, and policy publications that informed decision-making and supported systems change. IEL released the 2026 State of the States report, providing a comprehensive analysis of state education priorities, legislative outcomes, and investments in Community Schools to help decision-makers and practitioners understand emerging trends and opportunities.

Knowledge Gained and Applications

We design for impact:


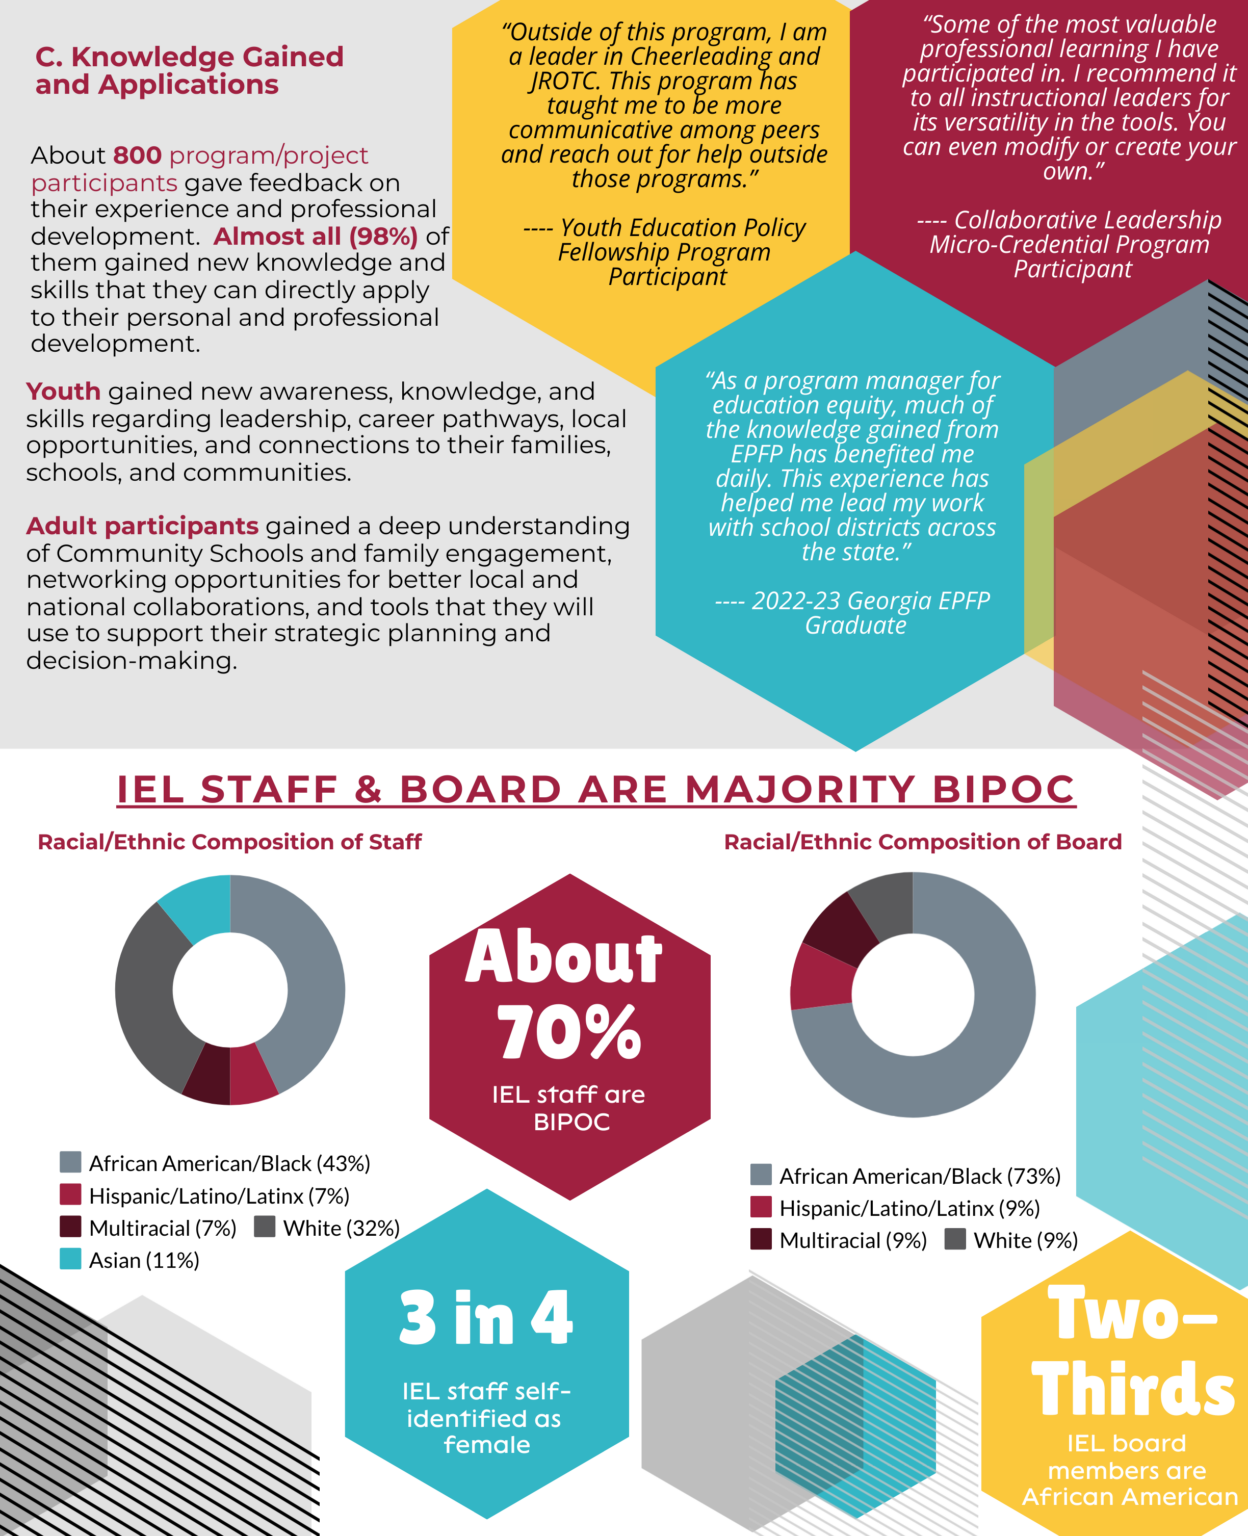
1) Our collaborative approach is focused on building sustainable leadership capacity that outlasts our presence; and 2) bringing multiple IEL resources to bear in targeted geographic communities allows us to deepen our impact.
3) Improved and more inclusive decision-making processes, systems and practices that ensure that all voices, particularly those of marginalized groups, are elevated and heard.
Increased number of leaders who can create and support policies that lead to more equitable opportunities and access.
4)Increased development and quality execution of equity-centered policies and practices that improve long-term life chances of people in our partner communities.
Improved access to quality educational and workforce resources for children, youth, and families.

Customized Programs

In FY26, IEL continued to advance its mission by delivering programs and services that strengthen leadership, expand opportunity, and build community capacity. Through initiatives such as the Ready to Achieve Mentoring Program (RAMP), the Right Turn Career-Focused Transition Initiative (Right Turn), the Youth Serving Professional Academy, and the Education Policy Fellowship Program
(EPFP), IEL supported youth and current and emerging leaders across the education and workforce sectors.

National Presence and Impact Through Leadership, Partnerships, and Advocacy

Building on the progress made in the first year of IEL’s strategic plan, FY26 (July 2025 – June 2026) was marked by continued growth, deeper collaboration, and measurable impact across our four-tier service model. Throughout the year, IEL strengthened networks,
expanded customized programs and convenings, advanced systems-change initiatives, and deepened place-based partnerships that support communities nationwide. Strategic practices in local collaboration, leadership development, and organizational capacity
building enhanced IEL’s leadership and amplified the reach of our work. The FY26 strategic impact highlights IEL’s continued progress in
expanding opportunity, strengthening communities, and leveraging resources to drive systems change through people.
Browse some of our state impact stories to learn more about how we change systems through people!

Scroll to Top