
About the Annual Youth Transition Report
The 2023 Youth Transition Report underscores the persistent and pernicious gap between youth and young adults with disabilities and those without disabilities on measures of success in education, employment, opportunity, and poverty. While data and reports exist for the working-age adult population and children with disabilities, IEL recognized a lack of information specific to the youth and young adult population in the 14-24 age group. IEL’s Youth Transition Report addresses this need by presenting an annual snapshot of the outcome gaps between youth and young adults with disabilities and those without disabilities, including opportunity youth whom the education and workforce systems have not adequately served and supported. This report consists of the status of the selected population and education, employment, opportunity youth, and poverty indicators.
Highlights from the 2023 Youth Transition Report
This report includes the analysis of critical educational and employment indicators for youth and young adults with and without disabilities at national and state levels. We have noted the age ranges used when data is unavailable or applicable for the under-16 or 18 population.
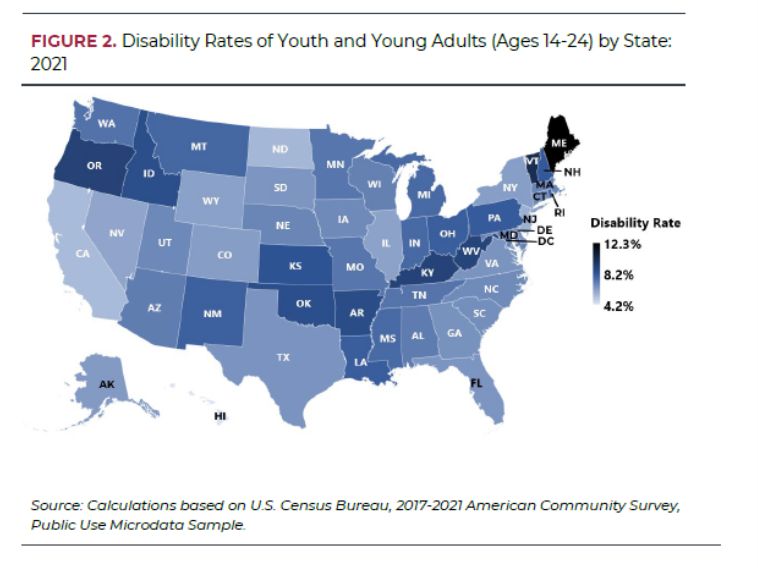
Disability Rates: While the population of youth and young adults with disabilities varies by state, in those states with the highest rates of disability for 14–24-year-olds, the rates were more than twice that of states with the lowest rates of disability. Disability prevalence in this age group ranged from a high of 12.3 percent in Maine to a low of 4.2 percent in Hawaii. In the past five years, Maine, Vermont, and West Virginia were the states with the highest rates of disabilities, and Hawaii, California, New Jersey, and Illinois were the states with the lowest rates of disabilities. The largest category of disability, which is self-reported through the U.S. Census, was cognitive difficulty (70.6 percent of youth with disabilities nationally).
High School Completion: Educational outcomes and attainment gaps between youth and young adults with and without disabilities varied by state. High school completion for students with disabilities ranged from the highest rate in Delaware (86.8 percent) to the lowest rate in Louisiana (69.8 percent). In addition, there remained a significant gap in high school attainment when comparing students with and without disabilities, with the widest gap being 16.8 percent. States with higher rates of high school diploma attainment for young adults with disabilities are more likely to have a smaller high school attainment gap between young adults with and without disabilities. For instance, as the state with the highest high school completion rate, Delaware was the only state with a close-to-zero high school attainment gap (0.9 percent) in 2021.
College Enrollment: College enrollment rates for adults aged 18-24 with disabilities in the U.S. was 28 percent compared to the national average of 43.1 percent for young adults without disabilities. States varied from the highest college enrollment rate at 44.8 percent in Rhode Island to the lowest at 17.6 percent in Alaska. The average gap in college enrollment between young adults with and without disabilities was about 15 percent nationally; no state has closed this gap.
College Completion: College completion at the bachelor’s degree level is another measure of success for young adults with disabilities. Academic success among states varied from the highest completion rate in Washington, DC (20 percent) to the lowest rate of completion in Alaska (0.6 percent). Nationally, the gap between those college students with and without disabilities was 7.5 percent.
Employment: Nationally, a slight trend over the past four years shows increased employment rates for youth with disabilities from 25.9% in 2018 to 28.1% in 2021. Youth and young adults with disabilities (ages 14–24) are about 15 percent less likely to be employed than their peers without disabilities. Of those youth and young adults with disabilities who were employed, the employment patterns are similar, with young people most likely to be employed by a private for-profit company or business. At the state level, North Dakota had the highest employment rates for youth and young adults with disabilities at 44.7 percent, and North Dakota was one of the states with the highest employment rate for youth and young adults with disabilities since 2017.
Opportunity Youth: Opportunity youth and young adults are commonly defined as those ages 14-24 who are neither in school nor employed. Our report examines the opportunity for youth not in school and not in the labor force, representing a true disconnection from systems. Opportunity youth with disabilities represented 19.3 percent of the national population compared to only 5.7 percent of opportunity youth without disabilities. Rhode Island was the state with the lowest opportunity youth rate in 2021, and it also had a small opportunity gap between youth and young adults with and without disabilities.
Poverty: Youth and young adults with disabilities are also more likely to live in poverty than their peers without disabilities. Poverty rates in some states, such as Kentucky and New Mexico, were more than 30 percent compared to a national average of 22.8 percent for youth with disabilities. Delaware and North Dakota showed a narrowing gap between youth with and without disabilities living in poverty from 2018 to 2021, and Delaware was the only state that had a close-to-zero poverty rate gap between youth and young adults with and without disabilities.
What do the data tell us about youth and young adults with disabilities?
In this fifth annual Youth Transition report, the gaps between youth and young adults with and without disabilities (ages 14-24) remain significant in almost every state in the U.S. across education, employment, engagement, and poverty indicators. Continued patterns of low high school and college completion lead to lower rates of employment and earnings, which in turn lead to higher rates of poverty for people with disabilities. Youth with
disabilities are more likely to be disengaged from school and the workforce. These patterns continue into adulthood.
View the full 2023 report, as well as previous reports below:
IEL Youth Transition Report 2023
Suggested Citation: Cheng, L., & Richardson, K. (2023). The 2023 youth transition report: Outcomes for youth and young adults with disabilities. Washington, D.C.: Institute for Educational Leadership.
IEL Youth Transition Report 2022
Suggested Citation: Cheng, L., & Shaewitz, D. (2022). The 2022 youth transition report: Outcomes for youth and young adults with disabilities. Washington, D.C.: Institute for Educational Leadership.
IEL Youth Transition Report 2021
Suggested Citation: Cheng, L., & Shaewitz, D. (2021). The 2021 youth transition report: Outcomes for youth and young adults with disabilities. Washington, DC: Institute for Educational Leadership
IEL Youth Transition Report 2020
Suggested Citation: Cheng, L., & Shaewitz, D. (2020). The 2020 Youth Transition Report: Outcomes for Youth and Young Adults with Disabilities. Washington, DC: Institute for Educational Leadership.
IEL Youth Transition Report 2019
Suggested Citation: Cheng, L., & Shaewitz, D. (2019). The 2019 Youth Transition Report: Outcomes for Youth and Young Adults with Disabilities. Washington, DC: Institute for Educational Leadership.