2021 Highlights
This report includes the analysis of key educational and employment indicators for youth and young adults with and without disabilities at both national and state levels. In cases where data is not available or applicable for the under 16 or under 18 population, we have noted the age ranges used.
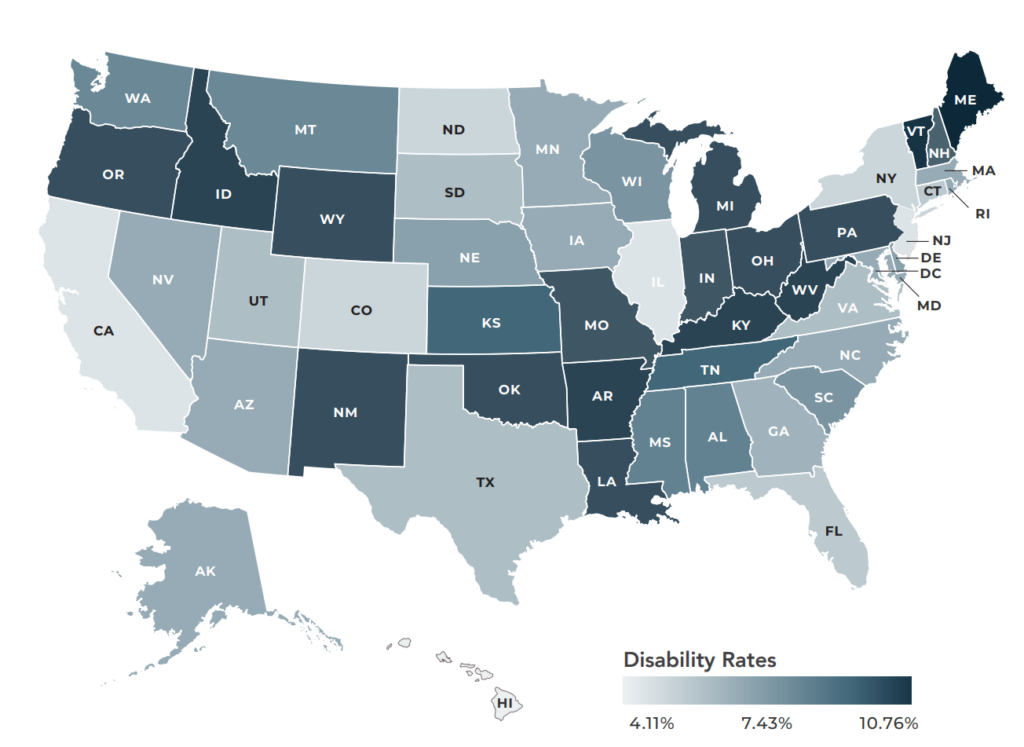
Disability Rates: While the population of youth and young adults with disabilities varies by state, in those states with the highest rates of disability for 14-24 year-olds the rates are more than twice that of states with the lowest rates of disability.
High School Completion: There remains a significant gap in high school attainment when comparing students with and without disabilities, with the widest gap at more than 21 percent.
College Enrollment: College enrollment rates for young adults aged 18-24 with disabilities in the U.S. is 27.3 percent compared to the national average of 43.4 percent for young adults without disabilities.
College Completion: The gap between those college students with and without disabilities was 7.4 percent.
Employment: Nationally, youth and young adults with disabilities (ages 14–24) are about 16 percent less likely to be employed than their peers without disabilities.
Opportunity Youth: Opportunity youth with disabilities represent 19.7 percent of the national population compared to only 5.6 percent of opportunity youth without disabilities.
Poverty: Poverty rates in some states such as West Virginia, Kentucky, New Mexico, and Mississippi are more than 30 percent compared to a national average of 24.2 percent for youth with disabilities; those rates are also higher than the national average poverty rate for youth without disabilities at 17.8 percent.
Suggested Citation: Cheng, L., & Shaewitz, D. (2021). The 2021 youth transition report: Outcomes for youth and young adults with disabilities. Washington, DC: Institute for Educational Leadership