About the Annual Youth Transition Report
The Annual Youth Transition Report underscores the persistent and pernicious gap between youth and young adults with disabilities and those without disabilities on success in education, employment, opportunity, and poverty. While data and reports exist for the working-age adult population and children with disabilities, IEL recognized a lack of information specific to the youth and young adult population in the 14 to 24 age group. IEL’s Annual Youth Transition Report addresses this need by presenting an annual snapshot of the outcome gaps between youth and young adults with disabilities and those without disabilities, including opportunity youth whom the education and workforce systems have not adequately served and supported. This report consists of the status of the selected population and education, employment, opportunity youth, and poverty indicators.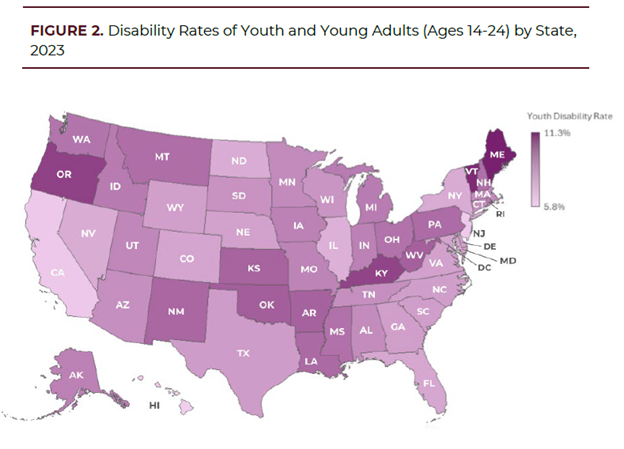
Explore our associated Transition-Age Youth and Young Adults with Disabilities Data Dashboard here.
Highlights from the 2025 Youth Transition Report
This annual Youth Transition Report summarizes analysis of key socioeconomic indicators for youth and young adults with and without disabilities. The findings focus on both national and state-level results. Throughout the report, “youth and young adults” refers to individuals ages 14 to 24, and we note when data limitations affect the inclusion of youth under 16 or 18. We primarily use self-reported census data in our analysis.
Disability Rates: Across the U.S., 7.6 percent of youth and young adults report having a disability. Disability rates vary by state, with the highest rates more than twice the lowest, ranging from 11.3 percent in Maine to 5.8 percent in Hawaii. Among all six disability types (hearing, vision, mobility, cognition, independent living, and self-care difficulty) reported by youth and young adults, cognitive difficulty is the most common, accounting for 71.6 percent of youth and young adults with disabilities nationally.
High School Completion: Nationally, 80 percent of youth and young adults with disabilities finish high school. State rates vary widely, from a high of 87.4 percent in Hawaii to a low of 75.3 percent in Florida. A significant high school completion gap remains between students with and without disabilities, with the national gap being 9.1 percent. New Hampshire has the largest gap at 12.7 percent, while Wyoming has the smallest gap at 1.3 percent.
College Enrollment: Nationally, 29.1 percent of young adults with disabilities ages 18 to 24 are enrolled in college, compared with 42.1 percent of their peers without disabilities. Enrollment rates differ across states, ranging from 17.2 percent in Alaska to 46.2 percent in Rhode Island. The national enrollment gap between young adults with and without disabilities was 13.1 percent. Alabama has the largest gap at 20.9 percent, while Alaska has the smallest at 5.2 percent.
College Completion: Nationally, just 6.5 percent of young adults with disabilities completed college in 2023. College completion rates among youth with disabilities also vary across states, from a low of 1.2 percent in Wyoming to the high of 18.1 percent in Washington, D.C. Nationally, the difference in bachelor’s degree attainment stands at 7 percentage points. State-level gaps range from 1 percentage point in New Mexico to 14.1 points in Washington, D.C. Although Washington, D.C. has the highest completion rate for youth with disabilities, it also has the largest gap between youth with and without disabilities.
Employment: Employment outcomes for youth with disabilities have improved over time, rising from 25.9 percent in 2018 to 31.6 percent in 2023. Still, youth and young adults with disabilities remain 11.6 percent less likely to be employed than their peers without disabilities. Among those who are working, the largest share is employed in private for-profit companies, reflecting broader patterns in the general youth labor force. State differences are substantial. North Dakota has the highest employment rate for youth with disabilities at 51.5 percent, while New Jersey has the lowest, with only about a quarter employed. The national employment gap between youth with and without disabilities is at 11.6 percent, with state-level gaps ranging from 2.8 percent in North Dakota to 17.3 percent in Maine.
Opportunity Youth: Opportunity youth are those aged 14–24 who are neither in school nor in the labor force, and they make up a large share of the population of youth with disabilities. Nationally, 18 percent of youth and young adults with disabilities are opportunity youth, compared to 5.6 percent of those without disabilities. Wyoming has the lowest rate of opportunity youth among its population of youth with disabilities (12.2 percent), and also the lowest difference in opportunity youth rates between youth with and without disabilities, at 7 percent. In contrast, Alabama has the highest rate of opportunity youth, at 23.2 percent, and the gap between those with and without disabilities, at 16.8 percent.
Poverty: Youth and young adults with disabilities continue to face higher levels of poverty than their peers. In 2023, 22 percent of youth with disabilities lived in households below the poverty line, compared with 15.6 percent of youth without disabilities. Kentucky and New Mexico had poverty rates above 30 percent for those with disabilities. Delaware reported a slightly negative poverty gap of –0.3 percent, meaning poverty rates among youth with disabilities were roughly on par with those of their peers without disabilities.
What do the data tell us about youth and young adults with disabilities?
Outcomes for youth and young adults with disabilities are improving compared to previous report years. Looking at long-term trends from 2018 to2023, the data show encouraging patterns of closing gaps in socioeconomic outcomes between people with and without disabilities. More youth and young adults are being diagnosed with disabilities, as seen in the 1.4 percent increase in disability prevalence in the 14 to 24 age group. Despite the increase, equitable outcomes are improving for transition youth with disabilities, though gaps in outcomes between those with and without disabilities persist and remain to be addressed.
View the full 2025 report, as well as previous reports below:
IEL Youth Transition Report 2025
Cheng, L., & Yeap, Q. F. (2025). The 2025 youth transition report: Outcomes for youth and young adults with disabilities. Washington, D.C.: Institute for Educational Leadership.
IEL Youth Transition Report 2024
Cheng, L., & Yeap, Q. F. (2025). The 2024 youth transition report: Outcomes for youth and young adults with disabilities. Washington, D.C.: Institute for Educational Leadership.
IEL Youth Transition Report 2023
Suggested Citation: Cheng, L., & Richardson, K. (2023). The 2023 youth transition report: Outcomes for youth and young adults with disabilities. Washington, D.C.: Institute for Educational Leadership.
IEL Youth Transition Report 2022
Suggested Citation: Cheng, L., & Shaewitz, D. (2022). The 2022 youth transition report: Outcomes for youth and young adults with disabilities. Washington, D.C.: Institute for Educational Leadership.
IEL Youth Transition Report 2021
Suggested Citation: Cheng, L., & Shaewitz, D. (2021). The 2021 youth transition report: Outcomes for youth and young adults with disabilities. Washington, DC: Institute for Educational Leadership
IEL Youth Transition Report 2020
Suggested Citation: Cheng, L., & Shaewitz, D. (2020). The 2020 Youth Transition Report: Outcomes for Youth and Young Adults with Disabilities. Washington, DC: Institute for Educational Leadership.
IEL Youth Transition Report 2019
Suggested Citation: Cheng, L., & Shaewitz, D. (2019). The 2019 Youth Transition Report: Outcomes for Youth and Young Adults with Disabilities. Washington, DC: Institute for Educational Leadership.